
Slickr is very cool. It will turn your PC into a pciture frame for the fabulous pictures being posted to Flickr. Get it here and install it today! Slickr
Read more!
Slickr is very cool. It will turn your PC into a pciture frame for the fabulous pictures being posted to Flickr. Get it here and install it today! Slickr
Inspired by the Apple iPod, iPhone or PC? How about Google Earth and other Google products? You should be it's about excellence in design and usage. Something to think about when designing a product and all the compromises we make.
Here is something that bugs me - the bu**sh** around health care. You have Medicare taking care of our elderly. The system works. It provides good health care at low cost. Even died-in-the-wool conservatives use it. It's a great model for universal health care. So why is government provide health care being demonized? I think it's the profit motive for health care management corporations. It's up to us to fight this mis characterization and defend the system.
I'm a huge fan of Google Earth. They have now added a full astronomy database. Check out my recent posts here at the Google Earth Forum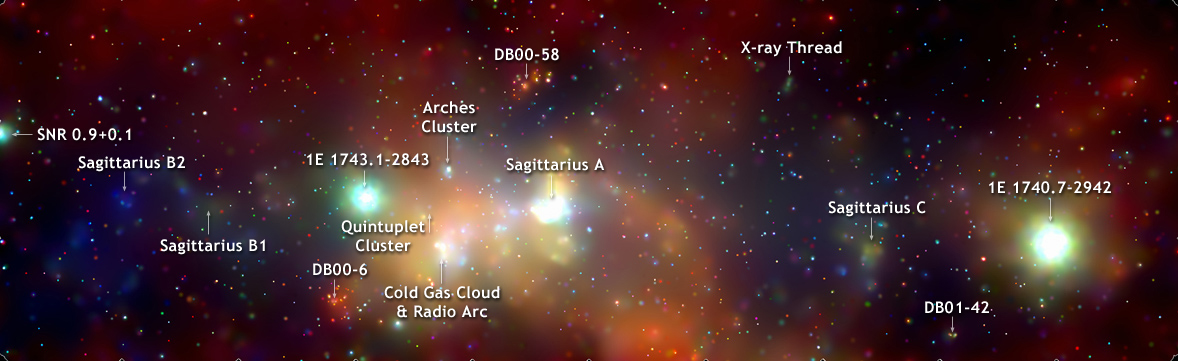
Black Hole in the Galactic Center
Perseids
Crab Nebula
Music I'm listening to
- The Shins
- Air
- Cowboy Junkies
- Queens of the Stone Age
- Mando Diao
- Arctic Monkeys
- Bob Dylan
Words choices drive define our worldview. No one understands this better than professional propagandists. I'd like to keep a list here of some particularly damaging words and phrases provided by the neo-facists and a counter choice that more accurately captures the concept.
If we were to substitute the more accurate phrase, we would have a more productive conversation. More strongly, we can challenge the use of these words in order to move the conversation towards reality.
War in Iraq = Iraq Occupation
Surge = Escalation
Tax Cut = Tax borrowing
SSI will be bankrupt in 2040 = SSI reduction benefits by 15 % in 2-4
Tax breaks = Corporate Welfare
The rich pay all the taxes = the rich have all the money
Dems want Big Government = Dems want Efficient government
Republican = Authoritarian
The Glaciers in Glacier National at park will be gone at by 2030. Read about it here
Table 1. Projected mean summer temperature, precipitation, glacier melt, and glacier area remaining in Glacier National
Park, based on a carbon dioxide–doubling scenario.
Mean temperature, Percentage of 50-year
July to August (1931–1980) mean Glacier area predicted Remaining glacier area
Year, predicted glacier area (km2)
---------------------------------------------
1990, 5.05
2000, 3.89
2010, 2.44
2020, 0.62
2030, 0.00
The Arctic icecap is or will soon be history. Check out this post from the NSIDC announcing the record ice cap shrinkage. It will be gone in our lifetime.
If we want to fix this we will need to sacrifice our CO2 emissions. This is not impossible.
Sept5 2007 Update
The icecap is now melted down to 4.4 M km^2. Looks like it is headed below 3M km^2. This is a 'seachange' to be sure
You may be under the impression that our Social Security System is somehow broken, and 'unfixable'. Turns out that's not quite right on both accounts. First it works quite well, and americans strongly support SSI. They want it to be funded. Lets ask what it would take to do that.
What would it take to fund SSI?
If you take a look at the SSI 2007 anual report you will see the following items:
The projected point at which tax revenues will fall below program costs comes in 2017 -- the same as the estimate in last year’s report.
The projected point at which the Trust Funds will be exhausted comes in 2041 -- one year later than the projection in last year’s report.
The projected actuarial deficit over the 75-year long-range period is 1.95 percent of taxable payroll -- .06 percentage point smaller than in last year’s report.
During 2006, an estimated 162 million people had earnings covered by Social Security and paid payroll taxes.
Social Security paid benefits of $546 billion in calendar year 2006. There were 49 million beneficiaries at the end of the calendar year.
The cost of $5.3 billion to administer the program in 2006 was a very low 1.0 percent of total expenditures.
The combined Trust Fund assets earned interest at an effective annual rate of 5.3 percent
.
I've been posting to a few web sites - Nanoscale Electronics News, Daily Kos, the Google Earth BBS for a few years. I like the opportunity to post freely my thoughts. I imagine a few folks enjoy my sparse posts, but I generally write not for an audience, but to release a few of the demons in my head.
I think I need more than that now. I want a more expansive place. I want it all to myself. A place where I can write boldly, then after reading what I have written, practice rewriting until it feels like I've finally discovered what I was hoping to illuminate.
I've become entrapped by the concept of living a good life. Not that I do so, but I'm curious what it means. Beyond good intentions, what we we really want? That will be the larger subject of this journal. We shall see how often I can return to add to these pages.
If you happen upon this page, feel free to comment, and post. I'm longing for dialog.