You may be under the impression that our Social Security System is somehow broken, and 'unfixable'. Turns out that's not quite right on both accounts. First it works quite well, and americans strongly support SSI. They want it to be funded. Lets ask what it would take to do that.
What would it take to fund SSI?
If you take a look at the SSI 2007 anual report you will see the following items:
The projected point at which tax revenues will fall below program costs comes in 2017 -- the same as the estimate in last year’s report.
The projected point at which the Trust Funds will be exhausted comes in 2041 -- one year later than the projection in last year’s report.
The projected actuarial deficit over the 75-year long-range period is 1.95 percent of taxable payroll -- .06 percentage point smaller than in last year’s report.
During 2006, an estimated 162 million people had earnings covered by Social Security and paid payroll taxes.
Social Security paid benefits of $546 billion in calendar year 2006. There were 49 million beneficiaries at the end of the calendar year.
The cost of $5.3 billion to administer the program in 2006 was a very low 1.0 percent of total expenditures.
The combined Trust Fund assets earned interest at an effective annual rate of 5.3 percent
.
Here is a web page which presents the basic data
Paying an extra 1.95% of our wages into SSI is unpalatable but it is affordable. If we really want our benefits, it's an easy choice.
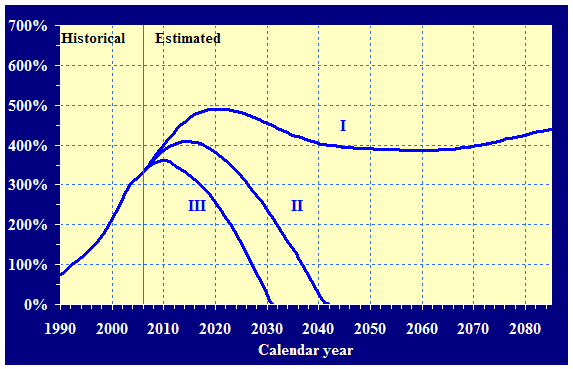
Or we can wait to see if the trust fund will actually be depleted. The chart below tracks the trust fund's behavior under 3 different assumptions about the economy. Trace #1 assumes lower cost and higher growth. In these conditions, you can see that the trust fund never depletes itself. If fact for the last 7 years this low cost scenario has been closer to reality that the more expensive scenarios.
Here is a good page describing these issues
And here is an interesting table. It shows posted shortfall date pushing out as we get closer to the date. Not a lot of reason to get worried if the fund is not actually going to deplete!
Report date = Trustee report date
Shortfall year = Year when tax revenue falls short of benefits
Negative income = Year when trust fund income falls below expenditures
depletion date = Trust fund depletion date
payroll shortfall = Shortfall as a share of taxable payroll
Report date..... . 1996, 1997, 1998, 1999, 2000, 2004, 2007
Shortfall year ....2012, 2012, 2013, 2014, 2015, 2018, 2017
negative income .. 2019, 2019, 2021, 2022, 2024, 2028,
depletion date ....2029, 2029, 2032, 2034, 2037, 2042, 2041
payroll shortfall .2.19% 2.23% 2.19% 2.07% 1.89% 1.89% 1.95%
No comments:
Post a Comment